General Information
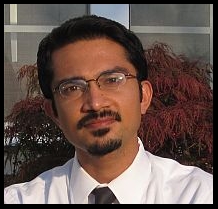
| Student: | [Neel Parikh] |
|---|---|
| Office: | [CoRE 450] |
| School: | [Stanford University] |
| E-mail: | [nparikh@gmail.com] |
| Project: | [Visualization of Time-Varying Graphs] |
Project Description
This project addresses the problem of visualizing graphs that are being collected in a streaming fashion. A central question is the identification of graph sub-structures and statistics on them that can be used as the basis to depict the graph evolution through time. Another key consideration is to come up with a visualization algorithm that gives stable layout over time, thus preserving the user's mental map.
Weekly Log
- Week 1:
- The members of our research group chose the specific projects we are going to work on. I will be continuing my research on visualizing time-varying data and working to extend our methods to handle data sets other than shipping manifest data. The main focus of my work will be to convert the processing pipeline into a streamlined sequence of processes that will be suitable for streaming data sets such as twitter messages.
- Week 2:
- My reasearch partner Mikey Chen and I used the discrepancy based manifest data analysis system that we had previously designed to visualize the Japan tsunami data set. Unfortunately, none of the fossil edges in the data log files were from ports in Japan. We concluded that the reason for this was because of the "background noise" of intermitant shipments from small ports globally. I filtered the graphs before discrepancy processing to extract edges originating from indiviual ports in Japan. Discrepancy processing on these graphs yielded better results. For example, edges for shipments originating from Kobe, Japan were slected as fossils and we were able to confirm that there was a noticeable drop off in shipment volume from Kobe about two weeks after the Tsunami hit Japan. Our findings were presented to the CCICADA nuclear detection group during our monthly meeting.
- Week 3:
- Mikey Chen finished his work visualizing manifest graphs with Gephi this week. I worked with him to learn about the implementation details of his code so that I could integrate his visualization steps with my graph processing steps. This included the processing to determine fossil edges and create the stream of events which are captured in the Gephi REC file format. It was apparent that much of the attribute creation and processing steps were duplicated in our respective parts of the projects.
much greater controll over the specifics of graph visualization. This included a multithreaded graph display feature with a built in force directed layout algorithm. Additonally, it will allowed for the addition of "sprites" to graph elements which allows us to add labels to the display without having to create "dummy" nodes.
- Week 4:
- The focus of this week's work was creating a streaming visualization of manifest data using a GraphStream graph as an event sink. The events were read from a Gephi REC file that was created using Mikey's WadjProcessor program on the Japan Tsunami dataset. Vertex styles were fully defined in a cascading style sheet instead of relying on attribute events from the REC file. Edge coloring and thickness attributes still came from the REC file but fossil edges were highlighted and labeled using the ui.class attribute. I also experimented with edges fading in and out, and though the result was visually appealing it generated too many events to maintain a smooth overall visualization. Special effects will most likely need to be done in separte threads.
- Week 5:
- I worked on completing the transition of visualization code to the GraphStream library. This meant altering the attribute creator proceses to make ids and values compatible with GraphStream syntax. Also, the events stream was changed so that it could be recorded in GraphStreams native DGS format instead of the Gephi REC format.
- Further work was done on separating processing steps into independent programs so that the bufferring can be added between each processing step.
- Week 6:
- Week 7:
Presentations
Additional Information
- My Mentor