
General Information
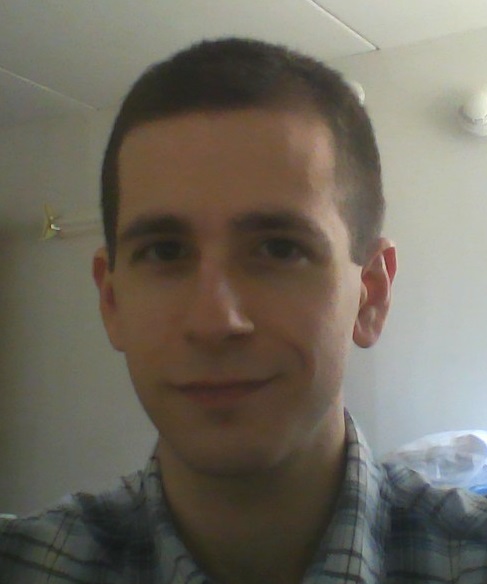
| Student: | Leo Behe |
|---|---|
| Office: | CoRE #448 |
| School: | Lehigh University |
| E-mail: | lcb213@lehigh.edu |
| Project: | Zipf's Law and Relational Learning: An Investigation of a Surprising Correlation |
Project Description
Machine learning has traditionally made the assumption that instances with a dataset are independent and identically distributed (IID). This assumption, while computationally simpler in spacetime, does not accurately reflect the heterogeneous nature of real-world data. To address this problem, statistical relational learning (SRL) has been introduced, which leverages higher-order relations between instances within a given feature space. This approach, although it will often outperform IID algorithms in prediction tasks such as classification, is more computationally intensive during training. Therefore, it is advantageous to know when the application of relational learning algorithms will outperform IID algorithms such as Naive Bayes on a given dataset. My project aims to investigate a possible correlation between Zipfian distributions of features in a dataset and the performance of relational learning algorithms such as Higher-Order Naive Bayes (HONB) on that dataset. I will run HONB on multiple datasets with varying levels of Zipfian correlation as well as varying formats (microtext, stopwording, character n-grams, numerical) to confirm or disprove this correlation. I will then attempt to formulate a theoretical explanation for this correlation if it is indeed confirmed. Ultimately, I hope to be able to devise a simple test of linear complexity that can be run on any given dataset to determine if relational learning will perform better than IID learning.
Weekly Log
- Week 1:
- After orientation, I conducted a literature search to come to an understanding of the current research in higher-order learning, character n-grams, and textual data classification. I created my DIMACS web page and designed an experimental methodology and slide-based presentation, both of which I discussed with my colleague and my two mentors. I then gave my presentation on Friday morning.
- Week 2:
- At the beginning of Week 2, I wrote some Java code that takes the output of the HONB code I'm working with and transforms it into a .csv file which can easily be plotted on a log-log graph to assess the Zipfian similarity. With the guidance of Dr. Nelson, my colleague Zachary Wheeler and I began step 1 in our experimental methodology- replicating the results previously produced by Brian Knopp last summer. We obtained the dataset used by Knopp and began running a subset of the tests that were previously run by Knopp. As of Friday the 13th, we are nearly done with the tests and will have them completed by the beginning of Week 3. Zach, Dr. Nelson and I also met with Dr. Trefor Williams, who provided us with several more datasets that will provide us with interesting test results. Shortly afterwards, Dr. Pottenger talked with us and we determined which datasets we will be running our initial tests on at the beginning of Week 3, once we finish our preliminary tests.
- Week 3:
- This week I ran tests on another dataset I located: a small microtext dataset based on tweets classified based on the sentiment of the tweet. I finished the tests on the Twitter dataset and began tests on a dataset provided by Dr. Williams, which is more significantly different from microtext than the Twitter dataset. I also presented my research up to date to the CCICADA weekly meeting on Thursday with my research colleague.
- Week 4:
- This week, while finishing the tests on both the dataset from Dr. Williams and a new dataset based on the National White Collar Crime Center (NW3C) data, I analyzed the test results to date and created a presentation with the significant test results re-formatted and highlighted. As well as holding my weekly update with Dr. Nelson and Dr. Pottenger, I continued to look at other datasets that may be useful to test, predominantly from the online UCI Machine Learning Repository. I identified several more possible datasets to use. I will be starting work on them after completing all other queued datasets and doing some further analysis of the tests so far.
- Week 5:
- This week I accomplished several things: First, I contacted Dr. Trefor Williams in order to get the contact information of the creator of a dataset we may be able to use. After Dr. Williams responded, I managed to open the dataset (which was in a .bak format which proved difficult to view) by setting up Microsoft SQL Server. I am now waiting for the response from Dr. Williams' contact. I also identified another dataset and began running tests on it: a dataset based on DNA sequences of 60 characters.
- Week 6:
- This week, my colleague Zach wrote a script to supplement the Java code I wrote earlier on. Zach's new script outputs all the results of a set of tests for a given dataset in an easily readable HTML format. I investigated a new dataset to possibly use- a dataset consisting of readings of seismic activity from a Polish mine. However, the data format is a little unorthodox and I am still working on generating a feature space that will properly represent the latent information in the readings. Additionally, I began running Zach's script on the completed dataset test results. We are now beginning to look at the results and try to spot possible correlations between the Zipfian distribution and HONB performance. Additionally, after talking with Dr. Nelson and Dr. Pottenger, I decided to rerun the DNA tests with higher values of N and overlapping n-grams.
- Week 7:
- This week we prepared for our Friday presentation. I produced more results in different formats, looking for interesting patterns. I met with Zach, Dr. Nelson, and Dr. Pottenger on Thursday to go over our presentation before Friday. In our presentation, we included several graphs highlighting interesting features I had discovered in the results so far. Additionally, during our update, we discussed the possibility of submitting an abstract for an upcoming conference. After the presentation, I continued to look at more results.
- Week 8:
- This week I continued to run tests on the 20 Newsgroups dataset. I made numerous additional graphs of the data produced, and I had an update with Dr. Nelson and Dr. Pottenger. Zach was being kept busy in Prague and wasn't able to join us. After I went over my results, Dr. Pottenger suggested a new way to graph the data and requested that I put error bars on the graphs. I have so far produced two new graphs of the style requested by Dr. Pottenger. I also began work on our final report, which is due in one week. I have done a rough draft of the abstract of the report, and I am working on getting in contact with Zach so that we can each work on different sections of the report.
- Week 9:
- This week I began writing my final report with Zach. I will be finishing it up and sending it in on Thursday.I ran some final tests and charted the results in Excel. I am also meeting with Dr. Nelson and Dr. Pottenger for the last time before I submit my report. We will determine whether or not to submit an abstract of our results to date to a journal. I am attending a final talk on Wednesday as well. On Thursday, I will be cleaning out my apartment, and I will leave on Friday morning.