General Information

| Student: | Jayshawn Cooper |
|---|---|
| Office: | Core 434 |
| School: | Morgan State University |
| E-mail: | jyshawncooper (at) yahoo.com |
| Project: | Topological Data Analysis and Fingerprint Classification |
Project Description
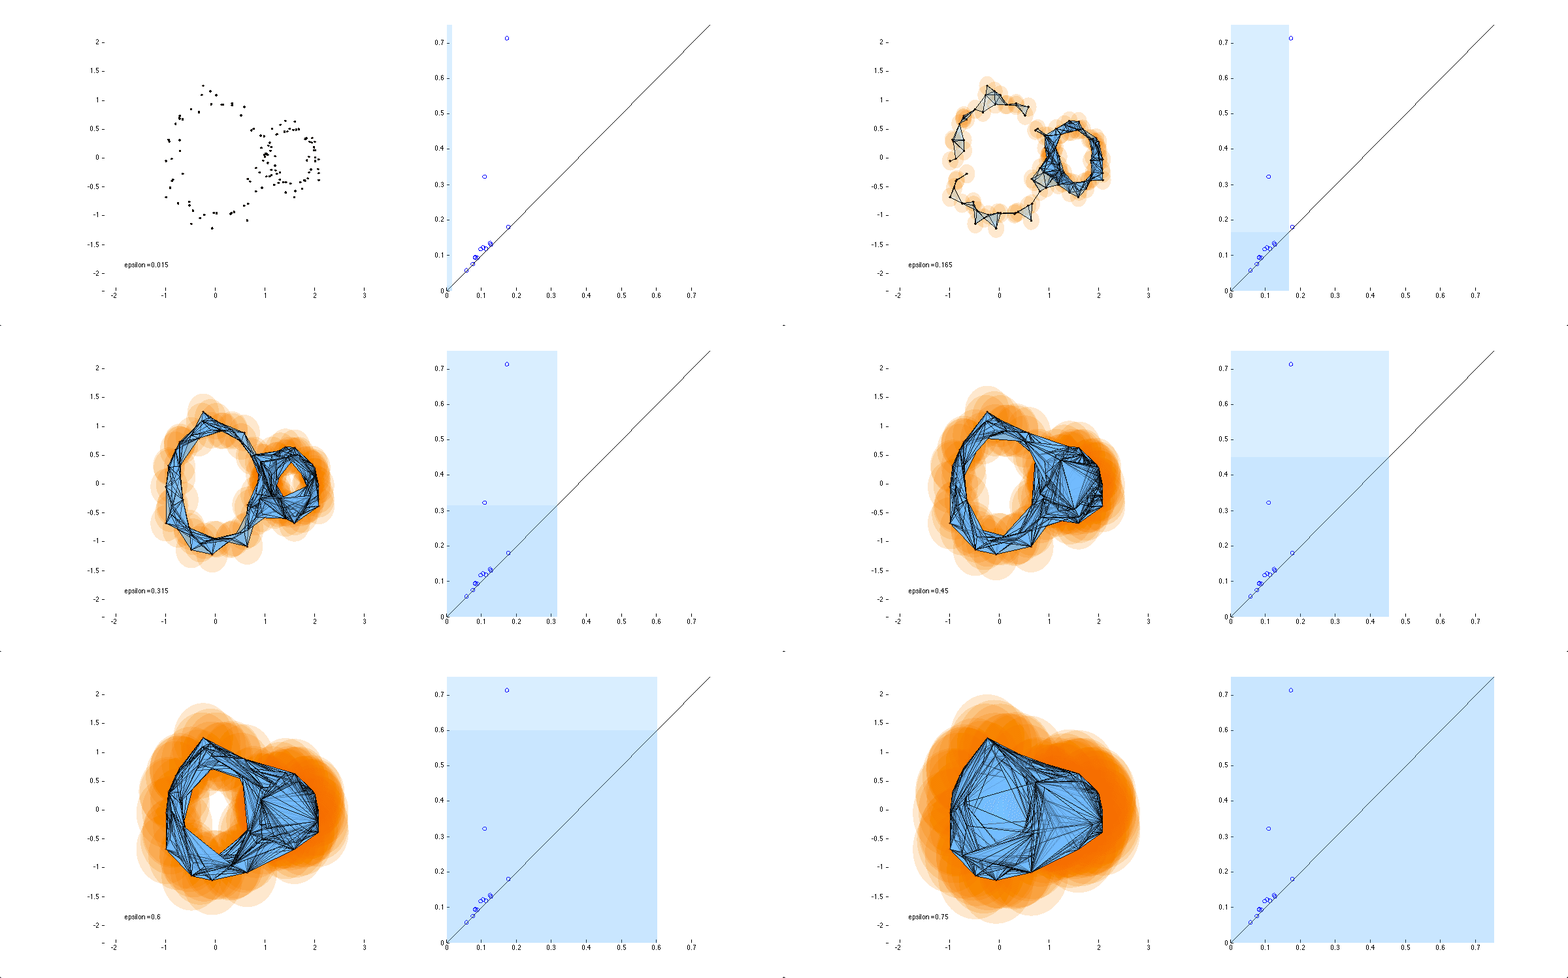
Fingerprints are often grouped into three main categories reflective of their shape: loops, arches, and whorls. Within these categories are various subcategories, e.g. tent arches, double loops, and pocket loops. This project will investigate the sensitivity of techniques in topological data analysis (TDA) to these existing classifications of fingerprints, as well as ask what other natural classifications might be found using TDA
Weekly Log
- Week 1:
- We read numerous papers on the classification of fingerprints, the ways of detecting cores and deltas of fingerprints using Poincare Index, and text on Persistent Homology. We then gave a presentation on describing the current process of classifying fingerprints and how we want to come up with a new way of doing this using Persistent Diagrams.
- Week 2:
- We downloaded a program to generate fingerprints, so we can come up with a data set of prints to analyze. We brainstromed ideas on how to approach our research, leading us to focus on viewing the persistence diagrams for cores and deltas for now. So, we must first come up with a program that transforms a 35x35 image containing a core into a height function, which we will then turn into a Persistence Diagram using another program.
- Week 3:
- This week I completed the 35x35 images of the cores and deltas, of our 100 generated fingerprints (around 20 for each category). Then I sent these bitmap images to my research partner Richard Avelar, and he adjusted them and turned them into distance functions using a program he created. Later we will turn these distance functions into Persistence Diagrams, hopefully there will be a clear difference between the diagrams of cores and deltas.
- Week 4:
- This week I analyzed our distance functions and our persistence diagrams, to confirm why they looked the way they did. We also discussed the methods to which we will compare our persistence diagrams, using Bottleneck and Wasserstein distances.
- Week 5:
- This week we saw our first core as a 3D image in the space of persistence diagrams, hopefully the rest of our cores look similar and our deltas look different from them. Also, I am trying to come up with a conjecture on wether or not if changing the greyscale of a single pixel will go unnoticed by the persistence diagrams.
- Week 6:
- This week we changed our data structure a little, reducing our data set to 5 cores and deltas for each class of fingerprints. We are also preparing for the presentaion, while I continue working on my conjecture.
- Week 7:
- We were finally able to observe and analyze our 3D point clouds, now we have to try and find some correlation between the cores and deltas of the different classes. Later, we presented what we have so far and what we planned to do for the future.
- Week 8:
- We came up with some quick experiments that we would like to test, and began discussing the paper.
Presentations
Additional Information
- My Mentors
- Research Partner
Filtration