Main
About Me
Project Description
Progress
DIMACS REU Website
Dr. Olson's Website
UMBC Website
|
Weekly Progress
Week 1:
I arrived at Rutgers on Sunday; Monday and Tuesday DIMACS held an
orientation to the program. During the remainder of the week, I met
Dr. Olson's graduate reserach group and went to a few DIMACS
seminars. I also read several articles and scientific papers to
familiarize myself with nucleosomes and the epigenome.
Week 2:

|
In addition to going to two DIMACS seminars
this week, I studied the Matlab and Python programming languages.
Using Excel, I created a table of parameters that could be input into
the w3dna website to generate 3D images of the specified DNA strand.
An example of these first images is to the left.
Student Presentations were held on the
Friday of this week, and I participated by giving an introductory PowerPoint
presentation, which can be accessed from the link below:
Presentation I
|
Week 3:
After studying Matlab for much of the
beginning of this week, I decided that the implementation of my
program (which was to randomly place nucleosomes on a DNA strand
according to observed probabilities and then generate output parameter
files describing the topology of the strand) would be completed more
easily using Python. Thus, I switched gears and began focusing solely
on Python. By Friday, I had a basic working program that would
generate a single file of parameters with each run.
Week 4:
|
I used this week to improve my program and
was able to make many output files of parameters at once. These
parameter files containing the relationship of DNA base-pairs to each
other could be rebuilt using an existing computer program to create
files describing the topology of the DNA strand at the atomic level.
Using Pymol, I was able to generate 3D images of the DNA. Such an
image can be seen to the right.
On Tuesday, two scientists from the UK came to
visit Dr. Olson's lab, and I attended their seminar with Dr. Olson and
her reserach group.
I concluded the week by beginning to write HTML
code for my REU webpage.
|

|
Week 5:

|
On Monday of this week I reviewed my
original program and added new code to create more realistic
images of the DNA. Originally I had worked under the assumption that
free DNA was perfectly straight, but this is not truly the case.
Thus, the new image on the left, the parameters of which were
generated by my program and used as input into Pymol, represents a
more faithful rendering of the DNA strand.
Having finished my program on Monday, I
changed focus entirely. For the remainder of the week I read
background material on DNA supercoiling and studied the mathematical
methods used to describe the topology of circular DNA molecules. My
reading took its form in two books: Unraveling DNA by
M. Frank-Kamenetskii and Topology and Physics of Circular DNA
by A. Vologodskii. An interesting lecture on the subject can be
found at the link below:
Lecture on DNA Twisting, Coiling, & Knotting
|
Week 6:
I continued to do background reading on DNA
loops this week and focused particularly on several papers describing
the mathematics behind computations involving twist, writhe, and
link.
In addition to attending a seminar and a field trip to Bell Labs,
I also started modifying a shell script written by Lauren
Britton later this week. This script automatically rebuilt the parameter files my
program created into xyz-coordinate files. These files could then be used to
calculate the end-to-end distance of each DNA strand in the hopes of
finding closed loops.
Week 7:
|
Early this week I finished modifying Lauren Britton's shell script and
wrote a short Python program to calculate the end-to-end distances of
DNA strands. I then ran the script overnight to generate 5000 sample
structures. Unfortunately, none of these structures represented
closed DNA loops, so I was unable to calculate their writhe values.
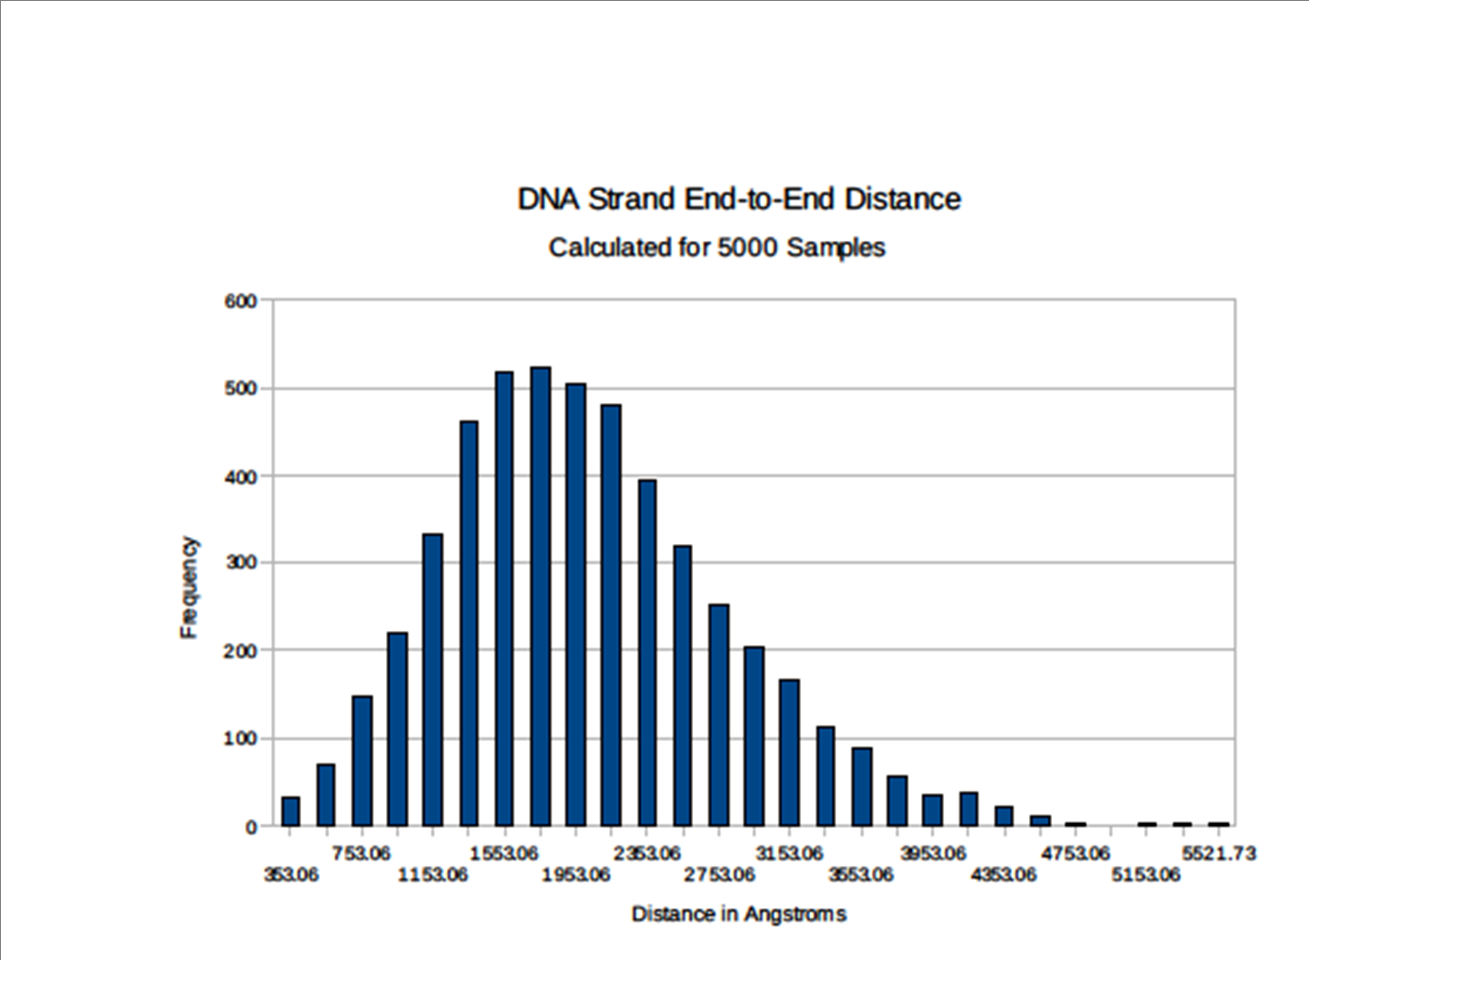
Nevertheless, I created a histogram to illustrate the
frequency of different end-to-end distances occuring. The image to
the right shows the DNA structure with the smallest end-to-end distance I
was able to find, and the histogram I constructed is below.
Final student presentations were held on
Friday of this week, and I participated by describing the work I did this summer via
a PowerPoint presentation. It can be accessed from the link
below:
Presentation II
|

|
Week 8:
This was my last week at Rutgers
University, and I used it to wrap up my REU project and say goodbye to
the program. I spent time
fulfilling my responsibilities to DIMACS and wrote up a final report
on my summer research. In addition, I went back to the code I created to add
comments and formatting so it would remain useful to future students.
|
