18th June 2012
A short introduction to DNA structure, as it applies to knot theory.
 If
we are to model a physical object or phenomenon using mathematics, we must first
ensure that the mathematical assumptions that we make lend themselves well to
the situation. That is, the mathematical objects should in some way
resemble the physical objects that we want to model. If
we are to model a physical object or phenomenon using mathematics, we must first
ensure that the mathematical assumptions that we make lend themselves well to
the situation. That is, the mathematical objects should in some way
resemble the physical objects that we want to model.
So why knots? Perhaps an even more pertinent question is,
"If DNA is a knot, what is it a knot of?" Not only are these good
questions to answer at the outset of our study, but they should be continuously
reevaluated as we learn more. Let's take the time to answer them with
care.
In the simplest sense, DNA is a curve of curves. In fact, it is best
modeled using three curves. Perhaps this is a bit surprising,
given the popularity of the idiom, "DNA double helix." To
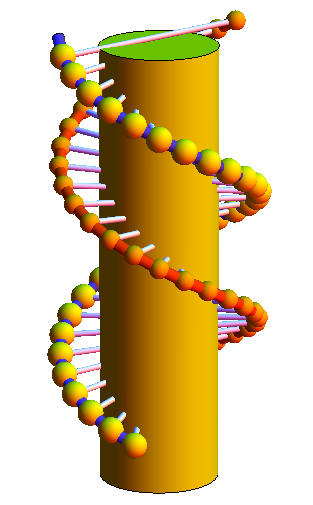
illuminate our reasoning, consider the figure to the left. The most
familiar features are the two backbones of the double helix (the "beaded" curves
in this figure) which are conventionally denoted by C and W
after their co-discoverers James Watson and Francis Crick. We also make
the case for an additional curve represented by the cylinder in the figure,
which we denote by F after Rosalind Franklin. Note that F
is defined by the midpoints between the C and W curves.
Why bother adding this F curve? If DNA is a double helix, surely
the C and W curves can adequately model its position and
orientation in space. The answer, as we shall see, is that the C
and W curves can indeed describe the position of DNA in space, but
using these in our model can also muddy the water. Quite frequently, we
are concerned with the global properties of very long DNA molecules. In
these situations, determining the spacing and distance between the C
and W curves would be labor-intensive and not particularly
enlightening. It is much easier to describe the molecule as one curve: the
F curve.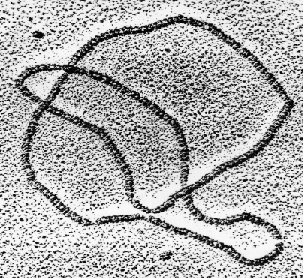
We still need to show that DNA knots - and there's no proof like a picture!
The image to the right is an electron micrograph of a knotted DNA loop.
Here, we see the F curve knotted on itself. Look familiar? Take a
look at the trefoil knot at the top of my previous post.
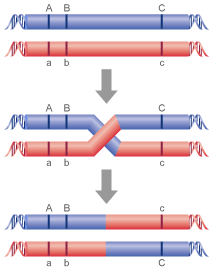
What causes DNA to knot in the first place? One way this can happen is
through recombination events. When two parts of a closed DNA loop get near
each other, short sequences on each part can trade places (see figure to the
left). In order for this to happen, the double helix must break which can
lead to knotting. Recombination events are quite common, and do much to
enhance genetic variation within a species. So there is certainly a great
deal of value in understanding this process and why the knotted products look
the way that they do.
Our next goal will be to integrate the information presented here with topics
from the previous post in order to devise mathematical methods for studying
knotted DNA. We will also present cases in which modeling DNA knots
mathematically can be much easier and more useful than more traditional
experimental techniques, particularly in the case of image processing.
The top figure on this page was generated by Wolfram
DoubleHelix.
The trefoil electron micrograph was taken by N. Cozzarelli, and the
recombination diagram was produced by
Wellcome Trust: The
Human Genome.
|